Analysis And Forecast
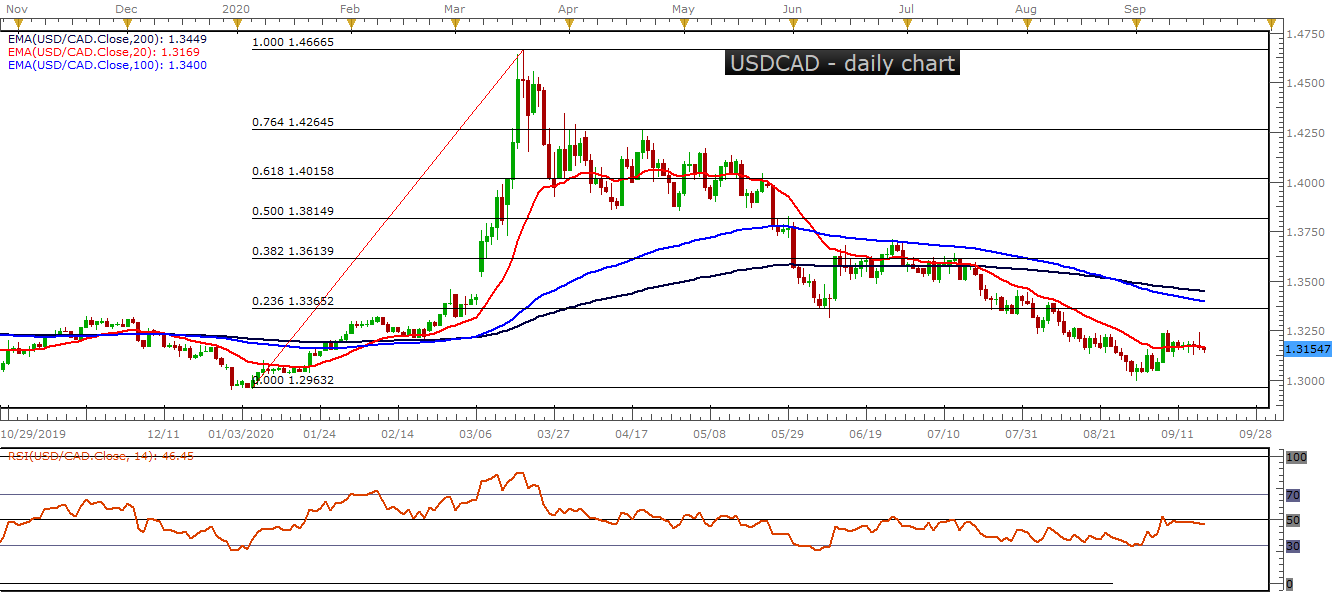
Upcoming Canadian retail sales figures for July may exacerbate the USD/CAD exchange rate’s fall from the monthly high, with a better-than-expected release reinforcing the Bank of Canada’s (BoC) view that “the Canadian economy has bounced back even more strongly in the reopening phase than we were expecting” and potentially justifying the central bank’s decision to maintain the status quo.
The BoC opted to maintain “its target for the overnight rate at the effective lower bound of 0.25%” and pledged to continue its quantitative easing (QE) program “with large-scale asset purchases of at least $5 billion per week of Government of Canada bonds” at its September meeting.
From a technical perspective, the path of least resistance for USD/CAD appears to be lower, as price failed to break back above the trend-defining 50-day moving average (1.3280) and September high (1.3259).
A daily close below the 21-DMA (1.3142) probably triggers an extended slide back to support at the 50% Fibonacci (1.3039), with a break below the psychologically pivotal 1.30 level potentially bringing the October 2018 low (1.2783) into play.
Forex, Commodities signals
Subscribe now to our exclusive forex signals
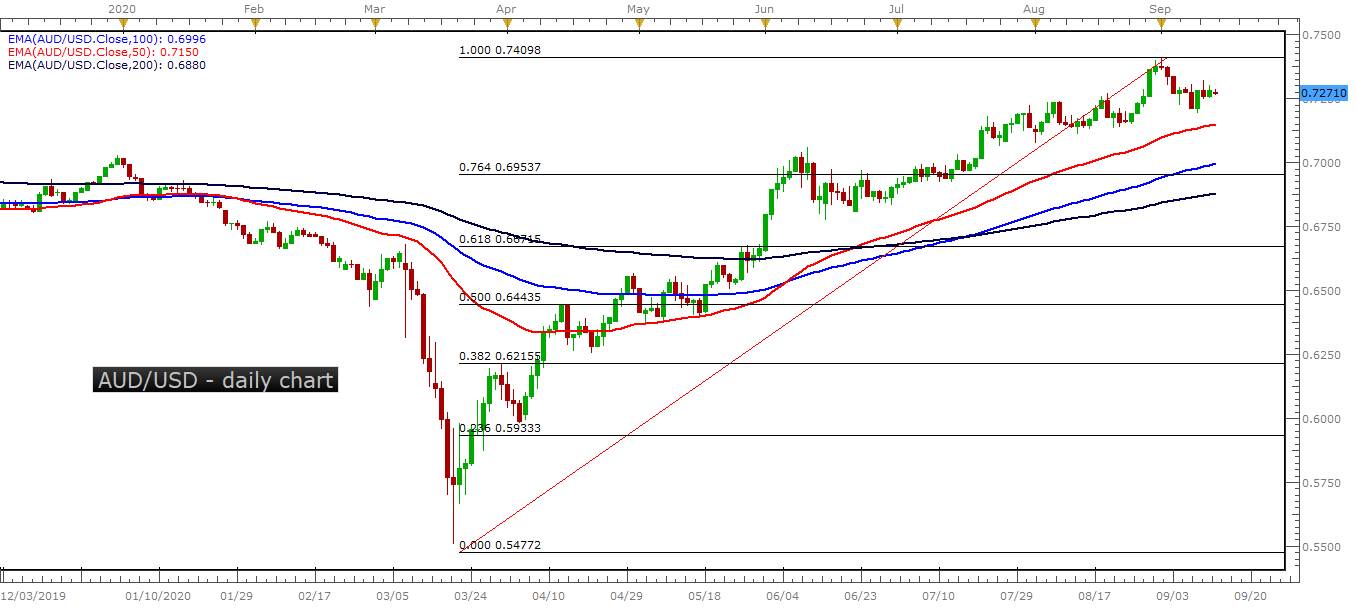
AUD/USD appears to be stuck in a narrow range after reversing ahead of the 50-Day SMA (0.7162), but fresh remarks from the RBA may rattle the rebound from the monthly low (0.7192) as the central bank warns that the economic recovery is “likely to be both uneven and bumpy.”
Hints of additional monetary support may produce a bearish reaction in the Australian Dollar as the RBA insists that “the yield target will remain in place until progress is being made towards the goals for full employment and inflation,” and the central bank may show a greater willingness to expand the scope of its emergency tool as “further purchases will be undertaken as necessary.”
Keep in mind, the advance from the 2020 low (0.5506) gathered pace as AUD/USD broke out of the April range, with the exchange rate clearing the January high (0.7016) in June as the Relative Strength Index (RSI) pushed into overbought territory.
AUD/USD managed to clear the June high (0.7064) in July even though the RSI failed to retain the upward trend from earlier this year, with the exchange rate pushing to fresh yearly highs in August and September to trade at its highest level since 2018.
Recent developments in the RSI instilled a bullish outlook for AUD/USD as it threatened the downward trend from earlier this year to push into overbought territory for the fourth time in 2020, but a textbook sell-signal has emerged as the indicator quickly slipped back below 70.
In turn, the bullish momentum may continue to abate following the failed attempt to test the July 2018 high (0.7484), with the 50-Day SMA (0.7162) on the radar for AUD/USD as it threatens the upward trend established in June.
Failure to hold above the 0.7270 (23.6% expansion) region may push AUD/USD back towards 0.7180 (61.8% retracement), with the next area of interest coming in around 0.7090 (78.6% retracement) to 0.7140 (23.6% retracement), which largely lines up with the 50-Day SMA (0.7162).
At the same time, a larger rebound in AUD/USD may bring the Fibonacci overlap around 0.7370 (38.2% expansion) to 0.7390 (38.2% expansion) back on the radar as the exchange rate clings to trendline support, with a break above the 2020 high (0.7414) opening up the 0.7480 (50% expansion) region.
Forex, Commodities signals
Subscribe now to our exclusive forex signals
https://forexcapitalexperts.com/services
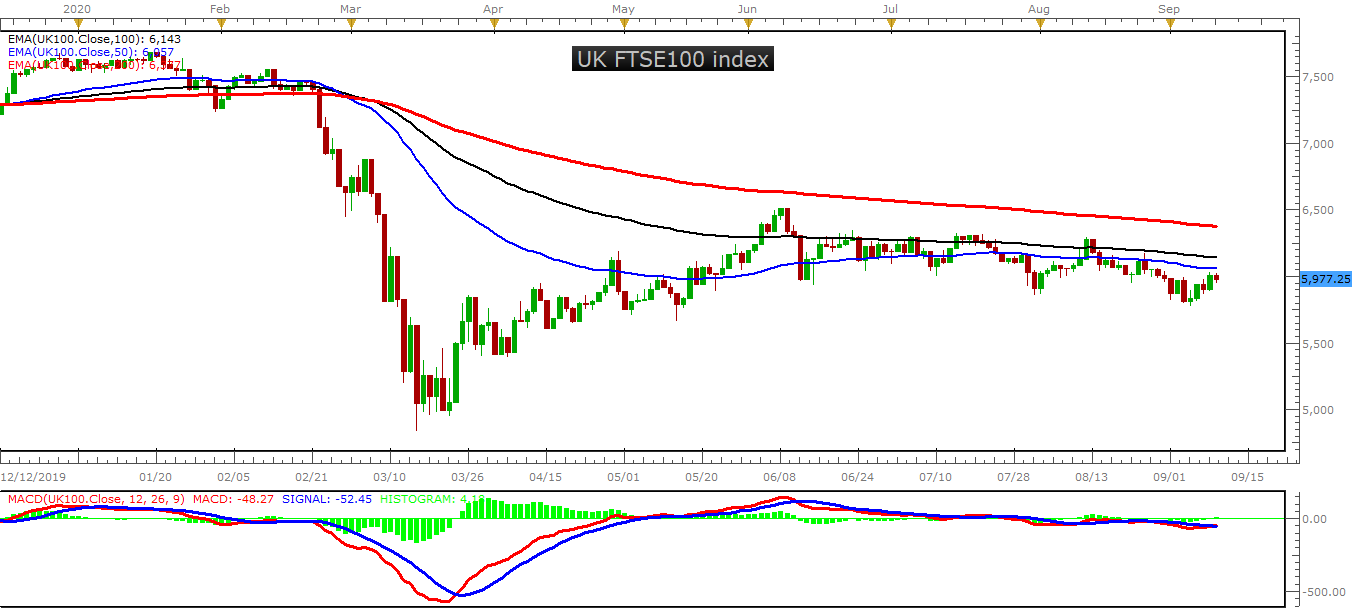
The FTSE looked headed for a breakdown last week, but managed to keep intact the integrity of the downward channel its been stuck inside the past few months. With last week’s hold the lower line of the channel since June just grew in importance.
The downward channel continues to dominate price action, but at some point this structure will get broken, whether that results in a downdraft or rally is to be seen. The longer the FTSE leans lower the higher the likelihood appears that we see a retest of the March low or worse.
For this scenario to gain traction the FTSE needs to drop below the lower parallel of the channel. Oftentimes when channels are broken in the direction of the trend the orderly price action becomes disorderly with a burst in the direction of the path of least resistance.
If, however, the FTSE can maintain the lower parallel, then it could set up to at least test the upper parallel, or better. At first it will be viewed as a line of resistance would-be sellers may want to use for solid risk/reward short entries. If the top-side line breaks, then the long-side could gain traction towards the falling 200-day at 6461.
For now, there isn’t much to be done other than be patient until either the bottom-side line is broken, top-side line tested/broken. At some point soon with summer ending we should see markets spring to life or fall quickly. A seasonally weak time of the year is being greeted with plenty of risks out there – Brexit, Coronavirus, and U.S. elections/China tensions, so the downside continues to the more likely direction over the coming weeks.
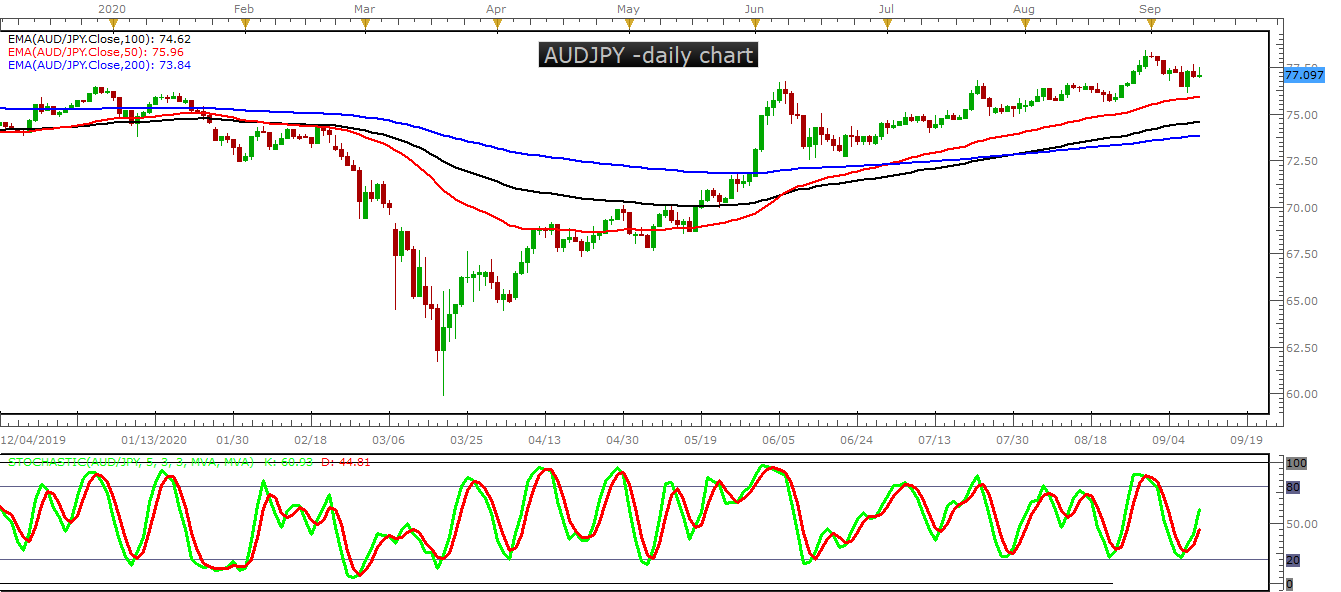
AUD/JPY had a nice ascending wedge going for it not too long ago, a pattern highlighted as giving the pair breakout potential. The lean was towards the upside given the pattern, and that we got, but there was also a question of how sustainable that breakout could be given long-term resistance.
So far those concerns are being validated as the wedge broke and price sagged back to the underside trend-line of the wedge. This is an important spot, because if support can hold then so can the upward bias towards another attempt to break the long-term downtrend line.
But if the lower side of the pattern breaks the move down could be even more powerful than a move up. First, you have that long-term resistance within a downward channel that suggests the long-term trend is down. Secondly, failed pattern breakouts can lead to an mass exodus with the crowd leaning the wrong way during the congestion phase that created the pattern in the first place.
Support is support until broken, and we have yet to see that happen. Using the overnight low at 76.11 as the level to watch. Stay above and a push higher could ensure, however, if it breaks then we should see AUD/JPY start to accelerate lower as the long-side of the market finds itself on its backfoot, with 72.52 (bottom of the wedge) as the first big target.
Forex, Commodities signals
Subscribe now to our exclusive forex signals
https://forexcapitalexperts.com/services
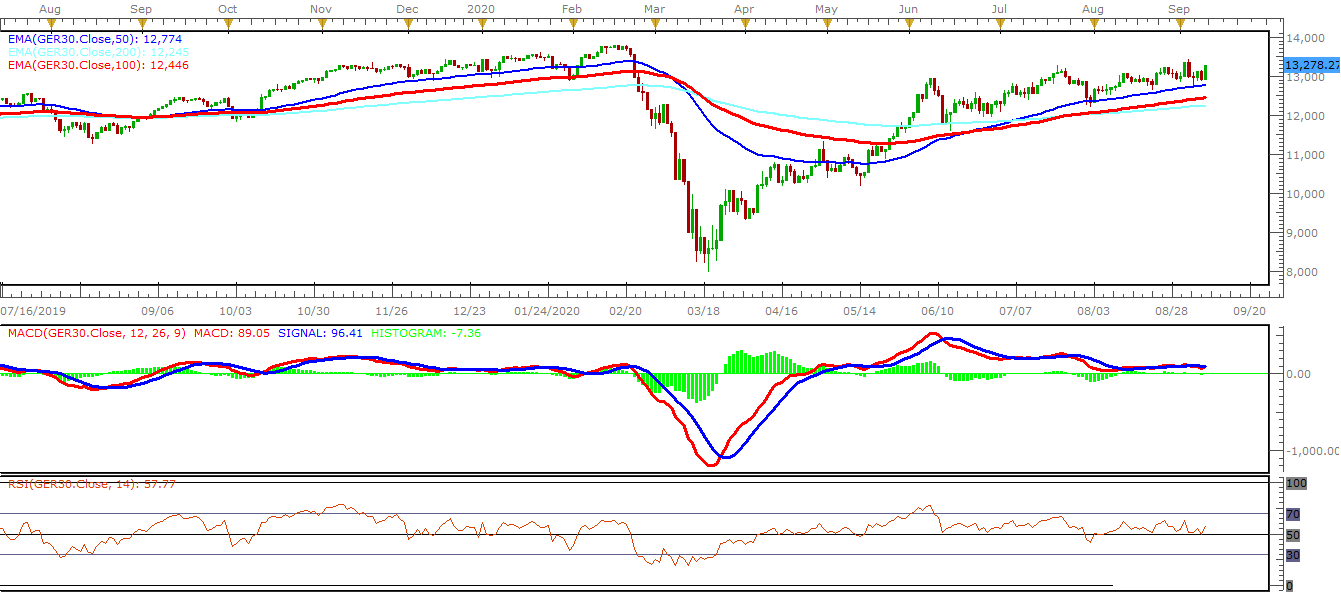
The sideways path in the DAX looks close to ending. The convergence in price over the summer months is setting up for a breakout scenario. Last week, the index attempted to fill the corona-gap, but the attempt was very short-lived as the gap-up into the gap was swatted back lower shortly after the open of trade of that day.
This brought an underside trend-line from June into play, a line that has several inflection points that make it a solid line of support. A break below it would likely lead to a sell-off towards the 200-day and July low at 12253.
But in recent sessions when the U.S. markets have worked off some their froth, Europe has held it together. This did not seem a likely scenario before as relative weakness in the DAX and CAC appeared to be sending a signal that they wanted to trade lower once the leading stock market took a break from rallying.
If the DAX can continue to show short-term relative strength in the face of further U.S. weakness, then this could set up for a sustained breakout into the corona-gap towards new record.
